0%

Common LaTeX Blocks Templates

1. Set geometries (boundary)

1
2
3
\usepackage{geometry}

\geometry{a4paper, top = 1.25in, bottom = 1.25in, left = 1.25in, right = 1.25in, headheight = 1.25in}

2. Figures

1
2
3
\usepackage{float}
\usepackage{subcaption}
\usepackage{graphicx}
figures

2.1 Single Figure:

1
2
3
4
5
6
\begin{figure}[H]
\centering
\includegraphics[width=0.35\textwidth]{blankfig.png}
\caption{XXXXXX}
% \label{XXXX}
\end{figure}

2.2 Two Independent Figures in One Row

1
2
3
4
5
6
7
8
9
10
11
12
13
14
15
\begin{figure}[H]%[htp]
\centering
\begin{minipage}[t]{0.47\textwidth}
\centering
\includegraphics[width=1\textwidth]{blankfig.png}
\caption{XXXX}
% \label{XXXX}
\end{minipage}
\begin{minipage}[t]{0.47\textwidth}
\centering
\includegraphics[width=1\textwidth]{blankfig.png}
\caption{XXXX}
% \label{XXXX}
\end{minipage}
\end{figure}

2.3 Two Subfigures in One Row:

1
2
3
4
5
6
7
8
9
10
11
12
13
14
15
16
17
18
19
\begin{figure}[H]
\centering
\begin{subfigure}[b]{0.47\textwidth}
\centering
\includegraphics[width=\textwidth]{blankfig.png}
\caption{xxxx}
% \label{xxxx}
\end{subfigure}
% \hfill
\begin{subfigure}[b]{0.47\textwidth}
\centering
\includegraphics[width=\textwidth]{blankfig.png}
\caption{xxxx}
% \label{xxxx}
\end{subfigure}

\caption{XXXX}
% \label{xxxx}
\end{figure}

3. Pseudo-codes

1
\usepackage[ruled, vlined, linesnumbered]{algorithm2e}
pseudo-codes
1
2
3
4
5
6
7
8
9
10
11
12
13
14
15
16
17
18
19
20
21
22
23
24
25
26
\begin{algorithm}[H]
\caption{Residual's Distribution Simulation}
\BlankLine
\SetAlgoLined
\KwIn{Number of sample needed ($num_{sample}$), $w_1$,$w_2$,$w_3$,$\mu_1$,$\mu_2$,$\mu_3$,$\sigma_1$,$\sigma_2$,$\sigma_3$.}
\KwOut{A sequence of random variables $\{X_i\}_{i = 1}^{num_{sample}}$ following target distribution.}

\BlankLine
i = 0\\
\While{$ i < num_{sample} $}{
$v_i$ $\sim \mathcal{U}[0,1]$\\
\uIf{$0<v_i \leq w_1$}{
$X_i \sim \mathcal{N}(\mu_1,\sigma_1^2)$ \;
}
\uElseIf{$w_1<v_i\leq w_2$}{
$X_i \sim \mathcal{N}(\mu_2,\sigma_2^2)$ \;
}
\Else{
$X_i \sim \mathcal{N}(\mu_3,\sigma_3^2)$ \;
}
i = i + 1
}
\Return{$\{X_i\}_{i = 1}^{num_{sample}}$ }

\BlankLine
\end{algorithm}

4. Tables

1
2
3
\usepackage{tabularx}
\usepackage{booktabs}
\usepackage{threeparttable}
tables

4.1 Narrow table

1
2
3
4
5
6
7
8
9
10
11
12
13
14
15
16
17
18
\begin{table}[H]
\centering\small
\setlength{\tabcolsep}{3mm}{
\caption{XXXX}
\begin{tabular}{cccc}
\specialrule{0.05em}{3pt}{3pt}
\toprule
X & X & X & X \\
\midrule
XXX & 0.928 & 0.2935 & 1.000 \\
XXX & 0.747 & 0.0526 & 1.301 \\

\specialrule{0.05em}{3pt}{3pt}
\bottomrule
\label{tab:compare2}
\end{tabular}
}
\end{table}

4.2 Text-width table

The width may be adjusted manually.

1
2
3
4
5
6
7
8
9
10
11
12
13
14
\begin{table}[H]
\centering
\caption{Experiment results for different "joins"}
\label{X}
\begin{tabularx}{\textwidth}{X X X}
\toprule
Header 1 & Header 2 & Header 3 \\
\midrule
Data 1 & Data 2 & Data 3 \\
Data 4 & Data 5 & Data 6 \\
\bottomrule
\end{tabularx}

\end{table}

4.3 With Footnote

1
2
3
4
5
6
7
8
9
10
11
12
13
14
15
16
17
18
19
\begin{table}[htb]
\centering
\caption{Final experiment results.}
\label{Table:finalresults}
\begin{tabularx}{\textwidth}{X X X}
\toprule
Header 1$^a$ & Header 2 & Header 3 \\
\midrule
Data 1 & Data 2$^b$ & Data 3 \\
Data 4 & Data 5 & Data 6$^c$ \\
\bottomrule
\end{tabularx}
\begin{tablenotes}
\item[1] \scriptsize a. Footnote a.
\item[2] \scriptsize b. Footnote b.
\item[3] \scriptsize c. Footnote c.
\end{tablenotes}
\vspace{-1.25em}
\end{table}

5. Listing (Code blocks)

1
\usepackage{listings}

5.1 SQL Style Setting

listings
1
2
3
4
5
6
7
8
9
10
11
12
13
14
15
16
17
18
% outside of document
\lstset{
language=SQL,
basicstyle = \tiny\ttfamily,
breaklines=true,
numberstyle=\tiny,keywordstyle=\color{blue!70},
commentstyle=\color{red!50!green!50!blue!50},frame=shadowbox,
columns=flexible,
rulesepcolor=\color{red!20!green!20!blue!20},basicstyle=\ttfamily
}
% inside of document
\begin{lstlisting}
SELECT u.province, c.chip_name AS ChipName, SUM(p.budget) AS revenue
FROM user AS u NATURAL JOIN package AS p, chip AS c
WHERE p.package_id=c.package_id AND province IN (%s)
GROUP BY c.chip_name
ORDER BY SUM(p.budget) DESC;
\end{lstlisting}

5.2 Python Style Setting

listing2
1
2
3
4
5
6
7
8
9
10
11
12
13
14
15
16
17
18
19
20
21
22
23
24
25
26
27
28
29
30
31
32
33
34
% outside of document
\lstset{
language=Python,
basicstyle=\small\ttfamily,
commentstyle=\color{gray},
keywordstyle=\color{blue}\bfseries,
stringstyle=\color{red},
showstringspaces=false,
numbers=left,
numberstyle=\tiny\color{gray},
stepnumber=1,
numbersep=10pt,
tabsize=4,
showspaces=false,
showtabs=false,
breaklines=true,
breakatwhitespace=true,
aboveskip=\bigskipamount,
belowskip=\bigskipamount,
frame=single
}
% inside of document
\begin{lstlisting}
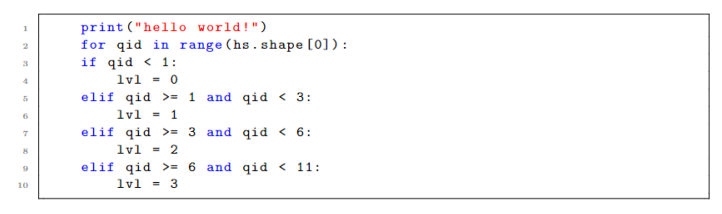
print("hello world!")
for qid in range(hs.shape[0]):
if qid < 1:
lvl = 0
elif qid >= 1 and qid < 3:
lvl = 1
elif qid >= 3 and qid < 6:
lvl = 2
elif qid >= 6 and qid < 11:
lvl = 3
\end{lstlisting}